Analyze
The last stage of the procedure. If you don’t have a sequence of images and an excel file with embolism areas then head over to capture then process for more information. Overview has more information about the project and background.
The end result of the analysis is an optical vulnerability curve which describes when air forms and spreads in the xylem in relation to the degree of drought stress experienced by the plant.
Analysis instructions can be found below:
Resources

 Play
Play
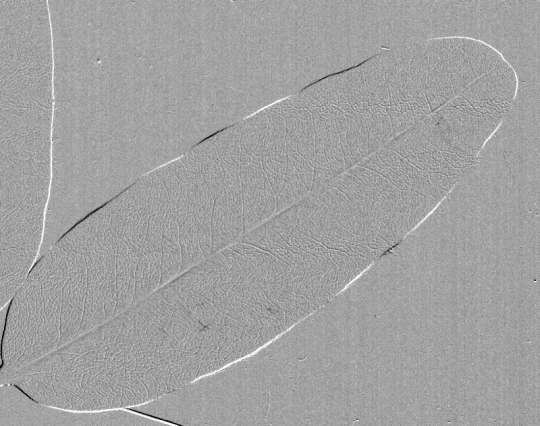
Eucryphia lucida leaf 2
Captured by Jen Peters from Western Sydney University visiting the Brodribb Lab in Hobart.